It is 10pm, do you know where your cores are?
Ever since multi-core processors hit the market I have always been interested in testing how well they actually work. Of course, there are application benchmarks, which are always a good measure, but I like to look at some basic properties of a new processor (I look at networking and storage in other tests). The compute testing I do is rather straightforward, yet I have seen very few of these types of results. In particular, most results are for Windows or involve "web benchmarks." Since I work in Linux High Performance Computing (Linux Clusters) sector, I thought some examples of how I evaluate multi-core may be of interest to others.
For these type of tests, the absolute best performance is not so important as the relative performance on a specific processor. Most of the tests are Fortran codes (one C code) that stress the number crunching capability of a processor. If you are interested in a good comparison of Fortran compilers take a look at Polyhedron Software where they have recent comparisons of many popular Fortran compilers for a Intel Core i5 2500k (3.30GHz) and AMD Phenom II X4 955 processor (3.2 GHz).
For this series of tests, I used gfortran, which by the way can usually hold its own against some of the other commercial compilers. I used the following processors fro my tests.
- Intel Core2 Quad-core Q6600 running at 2.4GHz (Kentsfield)
- AMD Phenom II X4 quad-core 910e running at 2.6GHz (Deneb) (Note: the initial version of this article mistakenly used 905e as the name of the processor, it was the 910e and has been updated throughout the article.)
- Intel Core i5 Quad-core i5-2400S running at 2.5 GHz (Sandybridge)
Note that the 910e and i5-2400S are 65W processors. Each is in a single socket desktop motherboard. The Q6600 was used as a reference against the new Intel Sandybridge and the aging AMD Deneb.
My motivation for this type of processor is the Limulus Project. Even though these processors are low-power desktop parts they work similarly to their big brother HPC versions. When Intel or AMD make a processor line "the guts" are basically the same. The marketing department slices and dices some of the features configuring products to reflect the market in which they will be sold. There are features servers need that consumer desktops do not (and vis-versa). Some of these options make sense from a technical standpoint, while others are just marketing games.
Generational advances (like memory architecture) travel through the whole product line from desktop to server. The high end server processor may work 20% faster than the lower end desktop processors, but the cost is usually much more (almost always more than 20%). Thus, by using lower cost desktop parts, a large percentage of the "high end" performance can be had at a low end price. The Limulus Project is designed to take advantage of this marketing trend. And, to be clear, the Limulus Project is not a replacement for a large server based cluster.
The testing is designed to measure how well a single multi-core processor performs with multiple programs running on it. Using single core performance as a measure of multi-core performance is difficult if not impossible. Thus, looking at parallel performance and scalability is the real measure of a modern multi-core processor.
For much of my testing I use the NAS Parallel Benchmark Suite. The NAS suite is a set of eight kernels that represent different aerodynamic application types. Each kernel is self checking, reports the run time, and offers a different memory access pattern. The "B" level test sizes were used. I also use the Beowulf Performance Suiteas framework for building and running the tests. The following software environment was used:
- Scientific Linux 6.0
- gcc version 4.4.4 20100726 (Red Hat 4.4.4-13)
- Open MPI 4-1.4.2
- Linux Kernel 2.6.32-131.2.1.el6.x86_64
Effective Core Test
The first test is based on a simple idea. If a single program/thread runs on a single core in X number of seconds, then Y copies should run in the same amount of time, provided Y is equal to the number of cores and there is perfect memory sharing (i.e. there is no memory contention). If it takes the collection of copies longer to run (than the single copy), then the number of “effective cores” is reduced. I created a series of scripts that works on on 2,4,8,12, and 16 cores (The four core example is given at the end of the column). The results are given below in both tabular and chart form.
| Test | AMD 910e | Intel i5-2400S | Intel Q6600 |
|---|---|---|---|
| bt | 2.1 | 2.0 | 1.6 |
| cg | 3.4 | 3.1 | 2.0 |
| ep | 4.0 | 4.0 | 4.0 |
| ft | 3.7 | 3.6 | 2.7 |
| is | 3.9 | 4.0 | 3.3 |
| lu | 2.3 | 2.5 | 2.1 |
| mg | 2.3 | 2.4 | 1.8 |
| sp | 2.4 | 2.1 | 1.5 |
Table One: Effective cores for NAS Parallel Kernels
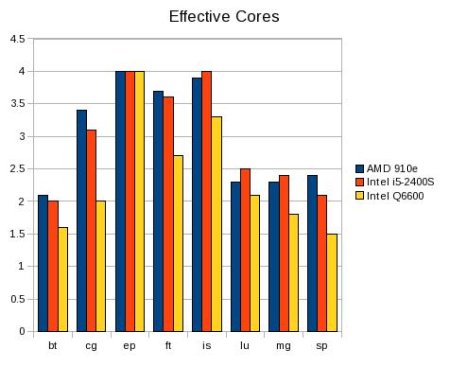
Figure One is a bar chart of Table One showing effective cores for NAS parallel kernels.
The results show a clear improvement over the Q6600 by both newer processors (due to better memory architecture). Interestingly, the 910e and the i5-2400S show about the same number of effective processors suggesting that the memory designs (each has two memory channels) are similar. Of course, the server version of these processors have more memory channels, better performance, and a higher cost. The important thing to note is no processor achieves perfect scaling for every test. Furthermore, one could argue that this is a "worst case" test and not likely to be how multi-core processors are used. As we shall see below, these results approximate the behavior of parallel programs.
Single Core Performance
I mentioned previously that single core performance was not as important as using all the cores. In order to measure the scalability, however, single core numbers are needed. The table below are the Million Operations Per Second (MOPS) for the NAS benchmark suite. Each test was run using just one core. Note: Except for IS (Integer Sort) MOPS is effectively Million Floating Point Operations per Second (MFLOPS) Also, note the number of MFLOPS varies by test.
| Test | AMD 910e | Intel i5-2400S | Intel Q6600 |
|---|---|---|---|
| bt | 1327 | 1950 | 981 |
| cg | 364 | 585 | 531 |
| ep | 11 | 15 | 11 |
| ft | 1020 | 1575 | 980 |
| is | 57 | 80 | 62 |
| lu | 1434 | 2054 | 1102 |
| mg | 1640 | 1949 | 1387 |
| sp | 1112 | 1427 | 800 |
Table Two: Single Core results for NAS Parallel Kernels
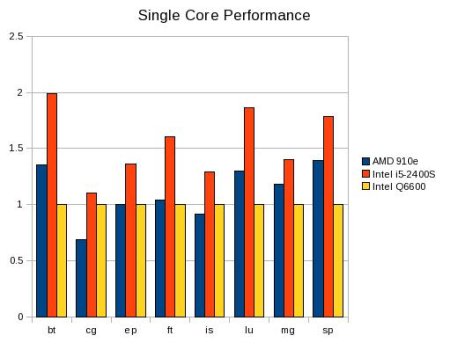
Figure Two is a bar chart of Table Two normalized to the
Q6600 results.
{mospagebreak}
Quad-core Performance
The NAS tests were then run using all four cores as an MPI program. The total MOPS is given in Table Three below.
| Test | AMD 910e | Intel i5-2400S | Intel Q6600 |
|---|---|---|---|
| bt | 2721 | 3841 | 1332 |
| cg | 1430 | 2418 | 911 |
| ep | 42 | 62 | 46 |
| ft | 2900 | 4306 | 1391 |
| is | 237 | 415 | 143 |
| lu | 4679 | 5730 | 2971 |
| mg | 3775 | 4694 | 1693 |
| sp | 2203 | 3013 | 1026 |
Table Three: Quad-Core results for NAS Parallel Kernels
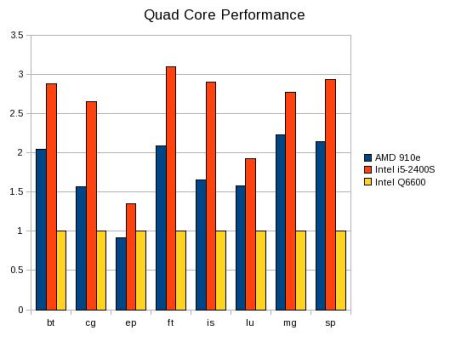
Figure Three is a bar chart of Table Three normalized to
the Q6600 results.
The final figure below is the scalability of each program. Like effective cores, perfect scalability would produce a 4X speed-up. Note that there is also some hyper speed-up, which is probably due to cache effects (i.e. each core is now running a smaller program that can better utilize the cache structure of the processor).
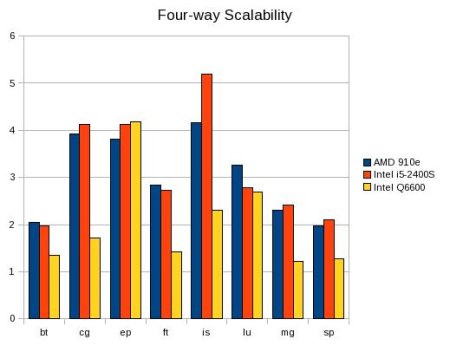
Figure Four is the scalability of each NAS kernel from the data in Table Three.
Discussion
The results shown above offer some insight into modern X86 multi-core processors. First, the effective cores test seems to be a good indicator as to how well a parallel program will perform on a multi-core processor. It seems to be a loose indicator of scalability. Consider tests bt,lu,mg, and sp. None of these tests were able to achieve more then 2.5 effective cores. When run in parallel, only lu was able to push a significantly above a scalability of two.Second, there is also an interesting lesson about single core vs multi-core results. Consider, the single core results for cg. The AMD 910e is the slowest, however, when run in parallel it over takes the older Intel Q6600 and shows almost perfect scalability. Thus, using single core results as predictor parallel performance is not always the best method.
Benchmarks are always revealing. Clearly, the better memory architecture of the latest AMD and Intel processors leads to better performance. The Sandybridge processor is the current leader in this category. As more cores are added to new processors, these types of tests become more important because good scalability (effective cores) gets harder. Of course, memory contention is the real issue with multi-core and mixing different programs with different access patterns may lesson the contention on a single processor. Finally, The parallel results were run using MPI. These results may vary using OpenMP and should make for another interesting set of tests on this processor group.
Listing Of the BASH Test Script
#!/bin/bash

# Requires NAS parallel codes (or your own) in PROGS line.
# Works Best with Beowulf Performance Suite
# See http://www.clustermonkey.net//content/view/38/34/1/0/
# Install BPS, use "-k" option for NAS test, copy this
# file into ~/bps-logs/npb

PROGS="cg.A.1 bt.A.1 ep.A.1 ft.A.1 lu.A.1 is.A.1 sp.A.1 mg.A.1"
echo "4 Way SMP Memory Test" |tee "smp-mem-test-4.out"
echo "`date`" |tee -a "smp-mem-test-4.out"
# generate single cpu codes change -c for different compiler
# comment if you do not need to generate the programs
./run_suite -n 1 -t A -m dummy -c gnu4 -o

for TEST in $PROGS
do
        bin/$TEST>& temp.mem0
        bin/$TEST>& temp.mem1 &
        bin/$TEST>& temp.mem2 &
        bin/$TEST>& temp.mem3 &
        bin/$TEST>& temp.mem4
        wait

        S=`grep Time temp.mem0 |gawk '{print $5}'`
        C1=`grep Time temp.mem1 |gawk '{print $5}'`
        C2=`grep Time temp.mem2 |gawk '{print $5}'`
        C3=`grep Time temp.mem3 |gawk '{print $5}'`
        C4=`grep Time temp.mem4 |gawk '{print $5}'`
        SPEEDUP=`echo "3 k $S $C1 / $S $C2 / $S $C3 / $S $C4 / \
        + + + p" | dc`

        echo "4 Way SMP Program Speed-up for $TEST is $SPEEDUP" \
        |tee -a "smp-mem-test-4.out"

done
/bin/rm temp.mem*
echo "`date`" |tee -a "smp-mem-test-4.out"
|

